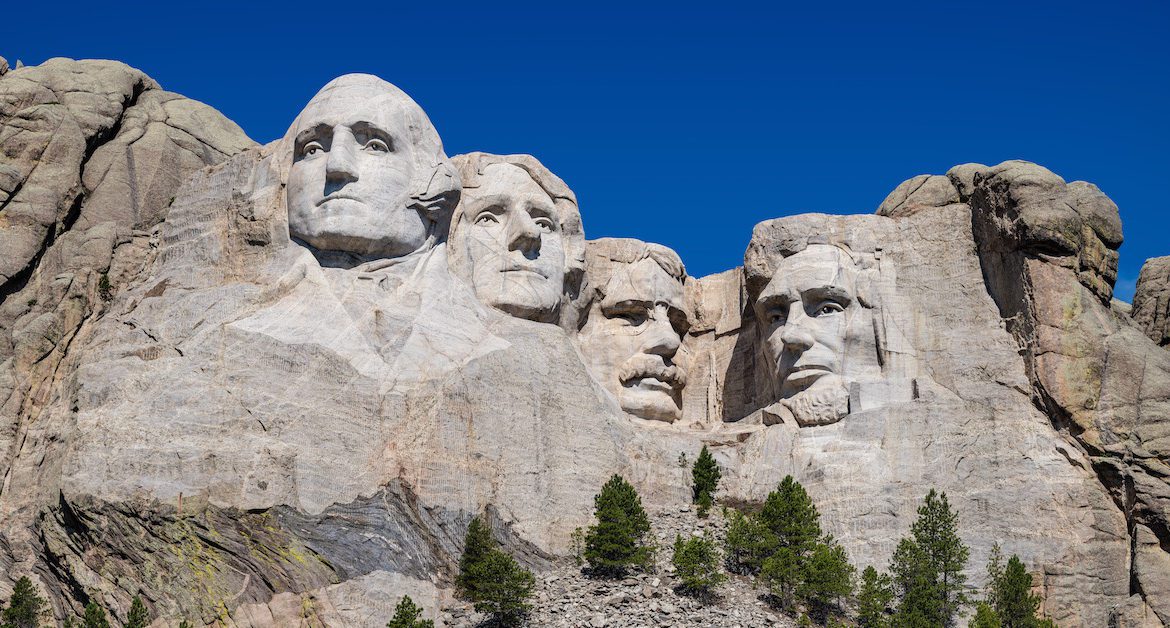
Creating a new Mount Rushmore based on the performance of Wall Street
When the nation elects a new president, it’s a moment where Washington D.C. and Wall Street converge. This is because Wall Street watches the outcome of elections closely, trying to figure out what it will mean for the stock and bond markets. There are lots of theories for what election results mean for the market. Some people think that Wall Street performs better when:
- A new president from a different party is elected;
- A president is re-elected to a second term; or
- There is a Republican/Democrat president.
Is there any proof of this? We ranked the best and worst presidents simply by the performance of the stock market in an attempt to settle the debate of what kind of election outcome is best for investors. While this sounds easy, there are a few big caveats to consider.
The Five Big Caveats
Caveat #1: The Office of the President was established in 1789 and since then America has had 45 different presidents. Three years later, Wall Street was officially founded on May 17, 1792 with the signing of the Buttonwood Agreement. However, there was no “stock market” in the sense that investors now know it, until the late 1800s. Because of this, it doesn’t make sense to include the first 22 presidents and the analysis starts with the election of 1888.
Caveat #2. When the Dow Jones Industrial Average was first published on May 26, 1896 and it followed the 12 largest companies in each sector, it now tracks 30. The other commonly-used index, the S&P 500, was introduced in 1957, but it does track data back to the late 1920s. This ranking uses the S&P 500 from President Hoover to the present and the DJIA for earlier.
Caveat #3. Returns do not include dividends. Over the last few decades, dividends have become a smaller component of total returns, so not including dividends will tend to favor more recent presidents.
Caveat #4. This data is not adjusted for inflation, which will tend to help presidents of inflationary times (Carter and Ford) and hurt presidents of deflationary times (Hoover and Bush).
Final Caveat. This one is sure to spark heated debate, but it seems fair to not include President Trump on this list simply because his presidency is still going.
Part I: #1 – #4
Part I brought us this list:
#1: President Herbert Hoover (-30.8% per year)
#2: President George W. Bush (-5.6% per year)
#3: President Grover Cleveland (-4.9% per year)
#4: President Richard Nixon (-3.9% per year)
Ranking from Worst to Best (#5 – #8)
#5 of 22
President Benjamin Harrison, Republican
Market Performance: -1.4% per year
Term: March 4, 1889 – March 4, 1893
Election Year: 1888
Most people don’t know much about the one-term President Benjamin Harrison. Perhaps only trivia experts recall that he was the grandson of President William Henry Harrison, which makes them the only grandfather-grandson pair to have lived in the White House.
Harrison’s presidency was largely unremarkable, but it was under his watch that the federal budget passed the $1 billion threshold (today it is about $4.8 trillion).
During his time in office, he helped pass the Sherman Antitrust Act and the McKinley Tariff, which imposed historical trade tariffs.
#6 of 22
President William Howard Taft, Republican
Market Performance: -0.1% per year
Term: March 4, 1909 – March 4, 1913
Election Year: 1908
President Taft is another one-term president and is more often remembered for his physique than any policy he enacted. The stock market was unremarkable during his term in the white house, losing 0.1% each year. Taft was also the only person to ever serve as president and Chief Justice of the Supreme Court.
Taft did push for more businesses to be broken up through lawsuits brought under the Sherman Antitrust Act, including suits against Standard Oil and American Tobacco and U.S. Steel.
#7 of 22
President Theodore Roosevelt, Republican
Market Performance: 2.2% per year
Term: Sept. 14, 1901 – March 4, 1909
Election Year: 1900 and 1904
President Roosevelt is the first person we’ve seen that is actually on the real Mount Rushmore, but he wouldn’t be if stock market performance was one of the criteria. Interestingly, Roosevelt was never supposed to take the highest office in the land, as he was President William McKinley’s vice president, but became the youngest president ever after McKinley’s assassination.
Remembered as one of America’s more colorful presidents, Roosevelt could also be confrontational and controversial as he fully embraced a cowboy, Rough Rider brand whenever he could.
Roosevelt also continued trust-busting by bringing lawsuits under the Sherman Antitrust Act and helped launch the Department of Commerce and Labor.
#8 of 22
President Woodrow Wilson, Democrat
Market Performance: 3.1% per year
Term: March 4, 1913 – March 4, 1921
Election Year: 1912 and 1916
President Woodrow Wilson had a tumultuous two terms. In that time, he accomplished a lot, including bringing back federal income taxes, creating a division that eventually became the Internal Revenue Service and introducing the Federal Reserve System.
Not to mention that on April 2, 1917, Wilson led the country into World War I when he asked Congress for a declaration of war against Germany. He also presided over the nation during the 1918 flu pandemic, even contracting the virus himself while negotiating the treaty of Versailles.
Generally, Wilson is considered a president who accomplished a great deal, the stock market during his presidency was rather lackluster, in part because of the cloud of WWI.