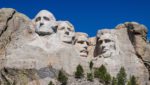
Creating a new Mount Rushmore based on the performance of Wall Street
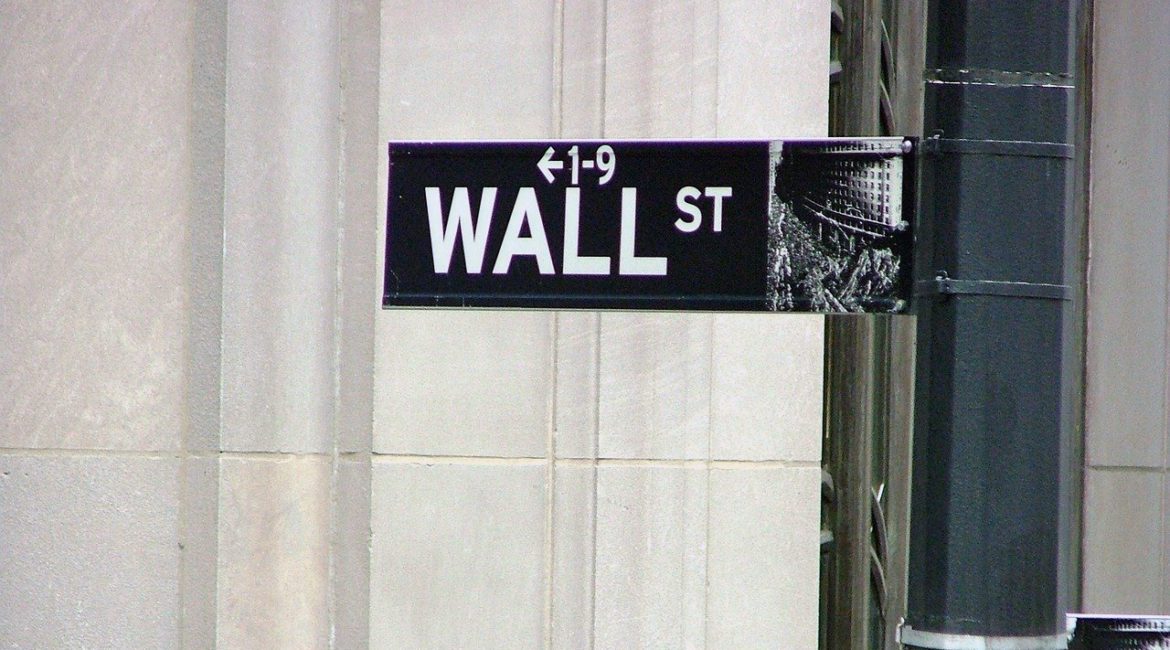
When the nation elects a new president, it’s a moment where Washington D.C. and Wall Street converge. This is because Wall Street watches the outcome of elections closely, trying to figure out what it will mean for the stock and bond markets. There are lots of theories for what election results mean for the market. Some people think that Wall Street performs better when:
- A new president from a different party is elected;
- A president is re-elected to a second term; or
- There is a Republican/Democrat president.
Is there any proof of this? We ranked the best and worst presidents simply by the performance of the stock market in an attempt to settle the debate of what kind of election outcome is best for investors. While this sounds easy, there are a few big caveats to consider.
The Five Big Caveats
Caveat #1: The Office of the President was established in 1789 and since then America has had 45 different presidents. Three years later, Wall Street was officially founded on May 17, 1792 with the signing of the Buttonwood Agreement. However, there was no “stock market” in the sense that investors now know it, until the late 1800s. Because of this, it doesn’t make sense to include the first 22 presidents and the analysis starts with the election of 1888.
Caveat #2. When the Dow Jones Industrial Average was first published on May 26, 1896 and it followed the 12 largest companies in each sector, it now tracks 30. The other commonly-used index, the S&P 500, was introduced in 1957, but it does track data back to the late 1920s. This ranking uses the S&P 500 from President Hoover to the present and the DJIA for earlier.
Caveat #3. Returns do not include dividends. Over the last few decades, dividends have become a smaller component of total returns, so not including dividends will tend to favor more recent presidents.
Caveat #4. This data is not adjusted for inflation, which will tend to help presidents of inflationary times (Carter and Ford) and hurt presidents of deflationary times (Hoover and Bush).
Final Caveat. This one is sure to spark heated debate, but it seems fair to not include President Trump on this list simply because his presidency is still going.
Parts I and II: #1 – #8
Parts I and II brought us this list:
#1: President Herbert Hoover (-30.8% per year)
#2: President George W. Bush (-5.6% per year)
#3: President Grover Cleveland (-4.9% per year)
#4: President Richard Nixon (-3.9% per year)
#5: President Benjamin Harrison (-1.4% per year)
#6: President William Howard Taft (-0.1% per year)
#7: President Theodore Roosevelt (2.2% per year)
#8: President Woodrow Wilson (3.1% per year)
Ranking from Worst to Best (#9 – #12)
#9 of 22
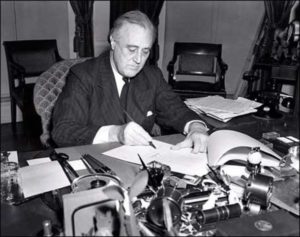
President Franklin Delano Roosevelt, Democrat
- Market Performance: 6.2% per year
- Term: March 4, 1933 – April 12, 1945
- Election Year: 1932, 1936, 1940 and 1944
Franklin Delano Roosevelt – FDR – has the distinction of being the longest-serving president in U.S. history. He was elected to four consecutive terms in the White House, but he only served a little more than 12 years before he died in office.
Roosevelt did take office in the middle of the Great Depression and in his first 100 days he helped push through massive federal legislation that kicked off the New Deal. The New Deal were federal programs designed to provide help to Americans to recover from the worst economic depression in the nation’s history.
Roosevelt is known for speaking directly to Americans with his “fire-side chat” radio shows. He was also the first president to appear on television. He led numerous programs for the unemployed, assisted farmers and helped bring an end to Prohibition. Other major programs implemented under Roosevelt include the Securities and Exchange Commission, the National Labor Relations Act, the Federal Deposit Insurance Corporation and Social Security.
While the U.S. economy improved significantly in the first 3 years after the Great Depression, a deep recession engulfed the country in 1937 and 1938, which explains the 6.2% per year performance.
#10 of 22
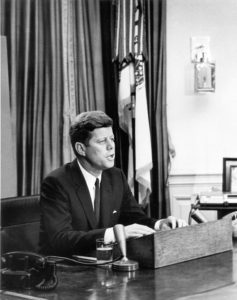
President John F. Kennedy, Democrat
- Market Performance: 6.5% per year
- Term: January 20, 1961 – November 22, 1963
- Election Year: 1960
John F. Kennedy – JFK – did not finish his term as he was assassinated less than three years into his presidency.
He’s best known for leading the establishment of the Peace Corps, his handling of the Cuban Missile Crisis, and inspiring Americans to fly to the moon. Economic historians recall Kennedy advocating for lower personal and corporate income taxes, which he said would stimulate more economic activity overall. This idea was coined as the “Laffer Curve” and was later adopted during President Reagan’s time in office.
Kennedy was leader during a breif, 6-month bear market from December 1961 to June 1962. During that time, the S&P 500 lost 28%. Otherwise, the 6.5% per year returns would have been higher.
#11 of 22
President Jimmy Carter, Democrat
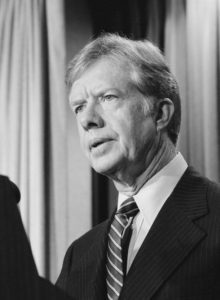
- Market Performance: 6.9% per year
- Term: January 20, 1977 – January 20, 1981
- Election Year: 1976
President Carter is unique in that he’s probably best known for what he did before and after he was president. Known as the “peanut farmer” before becoming president, and now his heroic human rights work post-presidency are well documented. Carter is regarded as one of the smartest presidents of all time, but the economic conditions of his presidency were besieged by low growth and high inflation. These are not good ingredients for out-sized stock market returns.
During Carter’s term in office, the Department of Energy and the Department of Education launched, but the last few years of his single-term presidency were marked by the Iran hostage crisis and the 1979 Energy Crisis.
#12 of 22
President Warren G. Harding, Republican
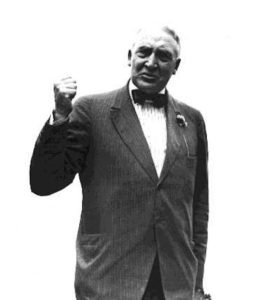
- Market Performance: 6.9% per year
- Term: March 4, 1921 – August 2, 1923
- Election Year: 1920
Harding was very popular at the time of his presidency. It was only after his death that his administration’s scandals came to light, including the Teapot Dome bribery scandal, considered one of the biggest political scandals of all time. Historians today generally consider Harding to be one of the worst presidents of all time.
When Harding took office in 1921, the country was in the midst of a post-World War I economic decline. Harding’s planned to reduce income taxes and increase tariffs to protect American farmers. He also supported the build-out of America’s highway system.
Harding died about half-way through his term from a heart attack. Despite the scandals that came to life after his passing, his stock market performance was just about in the middle.